
Gross yield sells brochures. Net operating yield pays your mortgage. Anyone weighing JVC against Arjan will find no shortage of listings claiming 8%, 9%, even 10% gross returns — but those numbers describe the rent divided by the purchase price. They ignore the single largest cost of Dubai property ownership: service charges. Once those are paid, plus management fees and vacancy, the picture shifts substantially — and it does not shift the same way in both areas.
This article does what the market rarely does: it strips both communities back to actual net operating yield, using worked numbers for studios and one-bedrooms across three realistic entry points. The goal is not to declare a winner. It is to give you the framework to see which area serves your specific investment profile.
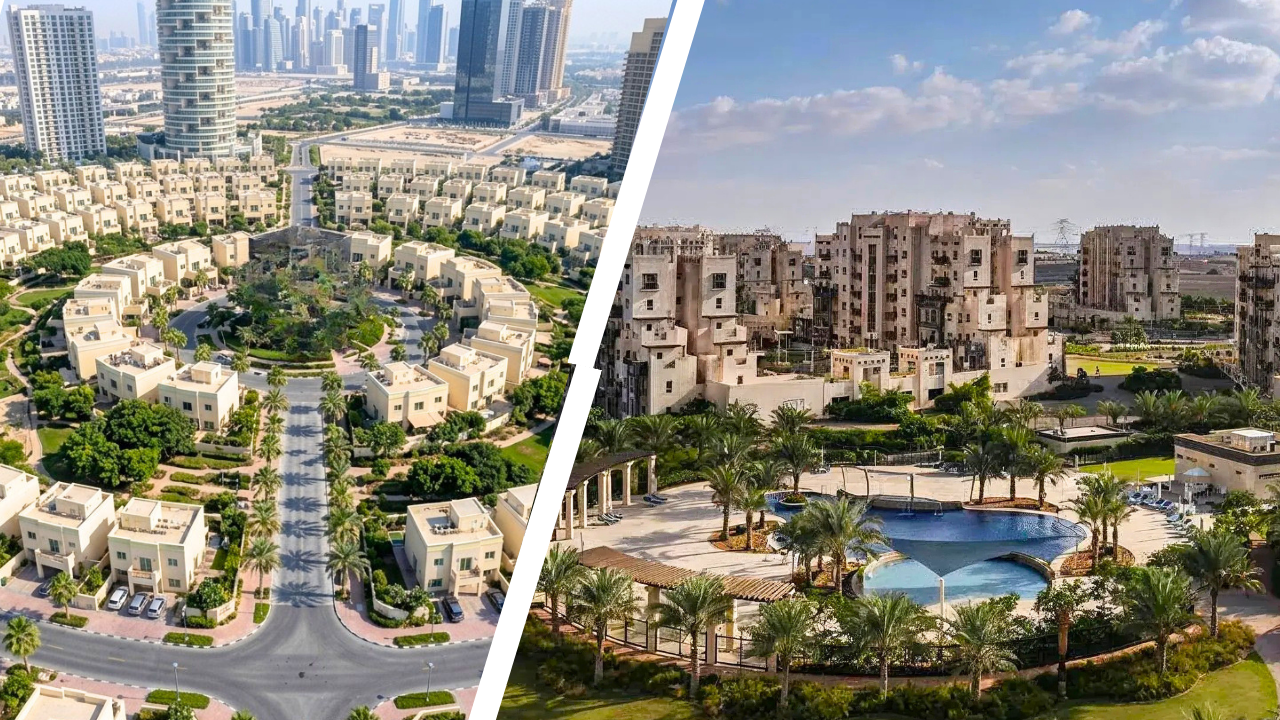
- JVC and Arjan look similar on gross yield — both often quoted in the 6–9% range depending on unit type — but net operating yields diverge once service charges are applied
- Reported service charges in JVC commonly range from around AED 8–10/sqft/yr in older mid-rise buildings to AED 15–20/sqft/yr in newer, amenity-heavy towers; Arjan typically sits around AED 10–16/sqft/yr for standard buildings and higher for boutique premium projects
- Recent market data places JVC median transacted prices around AED 1,347/sqft with median rents near AED 63,000; Arjan averages are broadly similar on a per‑sqft basis but vary by building and transaction type
- Studios in both areas consistently deliver the highest net operating yields — often in the mid‑5% to high‑6% range after selected costs, depending on service charges and rent
- JVC has recorded very high transaction volumes in recent periods (around 1,900 apartment sales in a recent 90‑day window per RE/MAX Hub), indicating strong liquidity relative to many communities
- The single biggest yield-affecting decision is not the area — it's the specific building's service charge rate and the actual rent achieved in that building
The setup: why these two areas end up on the same shortlist
JVC and Arjan compete for the same investor. They occupy near-identical price bands (both in the AED 1,300–1,400+ per sqft range for many ready apartments). Both sit in New Dubai's second ring — outside the immediate premium zone but well-connected to it. Both offer freehold ownership. Both are dominated by mid-rise apartment stock built for the mid-market rental tenant. And both promise the same investor story: mid-market entry price, strong rental demand, better yields than the prime zones.
The differences are where the investment analysis lives. JVC is larger, more mature, and has significantly higher transaction liquidity. Arjan is smaller, newer, more boutique-developer-driven, and sits closer to the Dubai Miracle Garden and Butterfly Garden — lifestyle anchors that some investors associate with short-term rental upside.
For an investor comparing the two, the question is not which area has the higher rent per sqft — those figures are close. It is which area, at a given specific building, will actually deliver the net operating yield that hits your bank account. That answer requires isolating the biggest variable: service charges.
Gross yield: the number every listing shows
All price, rent and yield figures below are based on DLD transaction data, RE/MAX Hub area summaries, Bayut market reports, GuestReady yield analysis and other publicly available sources current to mid‑2026. Property market data changes constantly; verify current figures with DLD records or a licensed agent before making any investment decision.
Let's establish the gross yield baseline first, because it is the foundation that everything else adjusts.
JVC gross yield picture
Based on recent DLD-registered data summarised by RE/MAX Hub, JVC's median transacted sale price is around AED 960,000 at approximately AED 1,347 per sqft, delivering a median gross yield near 6.6% on a median annual rent of roughly AED 63,000. New tenancy contracts — as opposed to renewals — are being signed at a median near AED 70,000, roughly 10–15% above renewal rates in some datasets. This is the price a landlord letting a fresh vacancy might target today. Some analysts and portal-based figures place JVC yields as high as 8–10%, but these tend to reflect studio-heavy samples, off-plan launch pricing or aspirational asking rents rather than DLD-registered transactions.
Arjan gross yield picture
Arjan's data comes primarily from Bayut, area guides and GuestReady analysis. Average price per sqft is around AED 1,355 for ready apartments — effectively similar to JVC on a like-for-like basis. Studios typically start from around AED 550,000 in selected listings, one-bedrooms from around AED 850,000 in some projects, though transaction-level data can show higher starting points depending on period and sample. GuestReady places Arjan's recent gross yields between about 6.4% and 7.6% across apartment types, with some newer towers pushing studio yields toward 8% or above in favourable cases. Average studio monthly rents sit just below AED 7,000 in many reports.
The headline conclusion at gross level: JVC and Arjan are roughly equivalent — both delivering gross yields in the 6.5–8% range across most unit types, with studios at the higher end. At the gross-yield stage, the two areas are effectively tied.
Service charges: where the two areas actually diverge
Service charges are the single largest cost variable in Dubai property ownership, and they can consume a large share of gross rental income. This is where the JVC vs Arjan comparison stops being tied and starts having a real answer — but only if you know the specific building.
| Area / building type | Typical service charge (AED/sqft/yr) | Building profile |
|---|---|---|
| JVC (older buildings) | ~AED 8–10 | 2010–2015 mid-rise, basic amenities |
| JVC (mid-tier) | ~AED 12–15 | 2016–2022 mid-rise, standard amenities |
| JVC (premium newer) | ~AED 15–20 | Post‑2022 high-rise, full amenity decks |
| Arjan (standard) | ~AED 10–16 | Mid-rise, standard amenity package |
| Arjan (boutique premium) | ~AED 16–22+ | Boutique developers, extensive amenities |
The important observation is that both areas have overlapping service charge ranges. There is no clean "JVC is cheaper" or "Arjan is cheaper" conclusion. What both areas share is significant building-level variation. A savvy investor targeting a boutique Arjan building at AED 20/sqft can end up paying more per sqft in service charges than a savvy investor targeting a well-run older JVC building at AED 10/sqft — despite Arjan's overall lower average.
The old-JVC vs new-JVC gap alone (AED 8 vs AED 20/sqft) can affect net operating yield by more than 1.5 percentage points. That is a bigger swing than the difference between the areas themselves.
"The single biggest yield lever is service charges. A JVC apartment at AED 12/sqft/yr service charges keeps more of gross; a branded residence at AED 30/sqft/yr keeps closer to 80–85%."
Adapted from market commentary in Miri Homes and similar reports
The full net operating yield calculation — three worked examples
Here is what net operating yield actually looks like after selected costs are applied. Each example uses a simplified formula: gross rent minus service charges, management fees (around 8–10% of annual rent), and a 4–6 week annual vacancy allowance, expressed as a percentage of purchase price.
Note: These examples show net operating yield before acquisition costs (DLD fee, registration, trustee fee, agent commission), financing costs, maintenance, insurance, leasing commissions, furnishing and other expenses. They are illustrative only and should not be treated as guarantees of future performance.
Mid-tier building, 450 sqft
| Purchase price | AED 700,000 |
| Annual rent (new-let) | AED 55,000 |
| Gross yield | 7.86% |
| Service charges (AED 14/sqft × 450 sqft) | −AED 6,300 |
| Property management (9% of rent) | −AED 4,950 |
| Vacancy allowance (5 weeks/year) | −AED 5,288 |
| Net income | AED 38,462 |
| Net operating yield | 5.49% |
Standard mid-rise building, 480 sqft
| Purchase price | AED 620,000 |
| Annual rent (new-let) | AED 48,000 |
| Gross yield | 7.74% |
| Service charges (AED 13/sqft × 480 sqft) | −AED 6,240 |
| Property management (9% of rent) | −AED 4,320 |
| Vacancy allowance (5 weeks/year) | −AED 4,615 |
| Net income | AED 32,825 |
| Net operating yield | 5.29% |
Post‑2022 premium building, 750 sqft
| Purchase price | AED 1,100,000 |
| Annual rent (new-let) | AED 78,000 |
| Gross yield | 7.09% |
| Service charges (AED 18/sqft × 750 sqft) | −AED 13,500 |
| Property management (9% of rent) | −AED 7,020 |
| Vacancy allowance (5 weeks/year) | −AED 7,500 |
| Net income | AED 49,980 |
| Net operating yield | 4.54% |
What these examples show is important. The gross yields are all clustered in the 7–8% range — the classic "affordable mid-market" story. The net operating yields tell a different tale: two studios in the 5.3–5.5% range, and a premium 1-bed in the 4.5% range. The service charge line is one of the biggest reasons for the gap.
Notice also that Example 1 (JVC studio at AED 14/sqft service) delivers a marginally better net operating yield than Example 2 (Arjan studio at AED 13/sqft). That is not because JVC beats Arjan — it is because JVC's rent-per-sqft on the studio in this example is higher. The variable that matters most is not the area — it's the specific rent, price and service charge on the specific unit.
Head-to-head: the direct comparison table
| Factor | JVC | Arjan | Comment |
|---|---|---|---|
| Price per sqft | ~AED 1,347 | ~AED 1,355 (ready) | Similar |
| Gross yield range | ~6.6–8.5% | ~6.4–7.6% | JVC (marginal) |
| Service charge range | ~AED 8–20/sqft | ~AED 10–22+/sqft | JVC (lower floor) |
| Median transacted price | ~AED 960,000 (RE/MAX Hub, recent period) | ~AED 913,000 (DLD-derived estimates) | Similar |
| Transaction liquidity | ~1,900 sales in a recent 90‑day window | ~3,600 sales/year (5‑yr avg, some sources) | JVC (higher recent volume) |
| Boutique developer product | Moderate | High (Ellington, Imtiaz, others) | Arjan |
| STR seasonal upside | Standard | Potential (Miracle Garden Oct–May) | Arjan (hypothesis) |
| School infrastructure | Extensive | Limited | JVC |
| Metro connectivity | Gold Line planned (inauguration 2032) | None confirmed | JVC |
| Rental tenant depth | Very high | Moderate | JVC |
JVC wins the majority of comparison points — but the picture is not one-sided. Arjan wins where it matters most for certain investor profiles: boutique developer quality at mid-market pricing, and the Miracle Garden seasonal narrative that JVC cannot match. Both areas have shown meaningful price movement in recent years, and the honest position on historical capital growth is that specific building selection matters more than the area itself.
Which investor profile suits which area
The right answer to "JVC or Arjan" is not universal — it depends on what you are trying to achieve.
| Investor profile | Better fit | Why |
|---|---|---|
| Yield-maximiser, studio focus | JVC | Best liquidity, deeper tenant pool, strong 5%+ net operating yield achievable in well-run buildings |
| Long-term capital appreciation | Both viable | Both areas have appreciated in recent years. JVC has Gold Line 2032 catalyst and more mature infrastructure; Arjan benefits from Miracle Garden and Dubailand growth narrative |
| Boutique-product buyer | Arjan | Ellington, Imtiaz and boutique-quality developers at accessible mid-market pricing |
| Short-term rental operator | Arjan | Miracle Garden Oct–May season creates potential concentrated STR demand JVC lacks (requires separate STR-specific modelling) |
| 1-bed buy-to-let, price-conscious | Arjan | Arjan 1-bed pricing starts around AED 850,000 in some projects — accessible mid-market entry point |
| Family-oriented tenant strategy | JVC | School infrastructure supports longer tenancies and potentially lower turnover |
| Portfolio diversification | Both | Different demand drivers reduce concentration risk |
What to check before you commit — the pre-purchase checklist
Request the exact service charge in AED per sqft for the specific building — not the area average. The building-level rate is one of the two biggest determinants of your net operating yield. Ask the developer or seller for the current charge and any history of increases.
Cross-reference the DLD rental register for the actual rents achieved in that specific building over the past 12 months. Portal asking rents are typically 5–15% above achieved rents. Ejari data gives you the truth.
Look up the DLD transaction history for that building to see resale price movement and time on market. A building with strong rent but slow resale carries hidden liquidity risk.
Understand the tenant profile the building actually attracts. A generic "young professional" catch-all does not tell you enough. Ask the agent or property manager who currently lives there, how long the average tenant stays, and what the turnover rate looks like.
Check the 2026 supply pipeline for that specific micro-location. A wave of new units delivering in your immediate corridor can pressure rents for 12–24 months. Bayut and Property Finder both publish handover schedules — use them.
Model the true all-in acquisition cost. Purchase price plus 4% DLD fee plus registration plus trustee fee plus agent commission — the total will be 7–8% above the sticker price. That directly affects your realistic net yield calculation.
The honest conclusion
JVC vs Arjan is not the right question. The right question is: which specific building, at which specific service charge, at which specific current rent, delivers the target net operating yield for your portfolio?
At the area level, the two markets are more similar than they are different. JVC has the edge on liquidity, capital growth track record, tenant depth, school infrastructure and future Gold Line connectivity. Arjan has the edge on boutique developer product at competitive pricing, lower 1-bed entry in some projects, and the STR seasonal narrative from Miracle Garden. Both deliver realistic net operating yields in the 5–6% range for studios in well-chosen buildings, and 4–5% for larger units, depending on assumptions.
The investor who assumes headline gross yield is what they will earn will be disappointed in both areas. The investor who models the full cost stack, chooses the specific building on the specific numbers, and matches their strategy to the area's strengths will do well in either. That is the framework that matters — the answer follows from applying it.
Methodology and sources
Figures in this article are based on a combination of:
- Dubai Land Department (DLD) transaction and rental data as summarised by RE/MAX Hub, Bayut, area guides and third-party analysts.
- GuestReady yield analysis for Dubai communities including Arjan.
- Publicly available information on the Dubai Metro Gold Line, including official announcements confirming a 42‑km route, 18 stations, AED 34 billion investment and an inauguration date of 9 September 2032, with JVC listed among served locations.
- General market reports on service charges, rental demand and community infrastructure.
Different market analysts use different methodologies and produce different figures for the same community, so any single number should be treated as directional rather than definitive. Building-specific price, rent and service charge figures vary significantly and should be verified individually. Historical capital growth data has been intentionally omitted from the comparison table where methodologies conflict — investors are advised to verify recent transaction history for the specific building before committing. All worked examples are illustrative only and use round figures for clarity — actual returns depend on the specific property, financing, tenant profile and market conditions. Service charges are set by Owners Associations and change annually. Readers should verify all current figures with DLD transaction records and a licensed agent before making any investment decision. Lavinia Properties is a real estate agency and does not provide financial advice.
The information in this article is provided for general guidance and market awareness. All price, rent, yield and service charge figures are sourced from Dubai Land Department transaction data, RE/MAX Hub summaries, Bayut H1 2026 market analysis, DLD-derived area datasets, Property Finder, area guides, Miri Homes, The Key Advisory, GuestReady and similar sources — current as of mid‑2026. Different market analysts use different methodologies and produce different figures for the same community, so any single number should be treated as directional rather than definitive. Building-specific price, rent and service charge figures vary significantly and should be verified individually. Historical capital growth data has been intentionally omitted from the comparison table where methodologies conflict — investors are advised to verify recent transaction history for the specific building before committing. All worked examples are illustrative only and use round figures for clarity — actual returns depend on the specific property, financing, tenant profile and market conditions. Service charges are set by Owners Associations and change annually. Readers should verify all current figures with DLD transaction records and a licensed agent before making any investment decision. Lavinia Properties is a real estate agency and does not provide financial advice.